Driving Safety Forward: Measuring Lane Quality with KPIs
At ViaSight, we believe that safer roads start with better data. Modern vehicles rely heavily on lane markings, not only for human drivers, but also for advanced driver-assistance systems (ADAS) and autonomous vehicles. To quantify lane quality and its impact on safety, we’ve developed a set of lane-specific Key Performance Indicators (KPIs). These KPIs turn raw camera and sensor outputs into meaningful insights for transportation agencies, researchers, and AV developers.
1. Lane Width Score
Lane width consistency is critical for driver comfort and safety. Narrow or irregular lanes increase risk, especially in work zones.
- How we measure it: We calculate the distance between detected left and right lane boundaries, normalize it using flat-top Gaussian method against expected lane widths, and remove outliers.
- Why it matters: DOTs can use this to identify segments where lane widths deviate from standards, which often signals repaving needs or faded markings.
2. Look-Ahead Score
Can drivers (and ADAS) reliably see the lane further down the road?
- How we measure it: We track lane-line continuity by analyzing horizontal pixel values. These values are normalized against the segment of data to capture the effective “length” of the detected lane ahead
- Why it matters: Discontinuities or short look-ahead distances reduce reaction time and create risks, especially at higher speeds.
3. Lane Intensity Score (Lane Pixel Density)
This KPI quantifies how strongly the lane stands out against the road surface.
- How we measure it: Pixel density analysis of detected lane regions using lane-mask output.
- Why it matters: High-intensity scores correlate with fresh paint and strong retro-reflectivity; low scores often reveal faded markings.
4. Lane Confidence
Lane confidence is a helpful indicator that shows how strongly the model detects visible lane markings. High scores often reflect well-maintained paint and clear visibility, making it useful for assessing road quality. At the same time, strong road edges or pavement contrasts can sometimes trigger high confidence even without painted lanes, so this KPI is best used alongside continuity, width, and visibility measures.
- How we measure it: Taken directly from the lane detection neural network.
- Why it matters: Gives agencies a way to spot “weak detections” and investigate whether the issue is due to poor markings, shadows, occlusions, or any other reason.
5. Lane Visibility Score
Visibility determines whether a lane is clearly recognizable to both humans and machine vision.
- How we measure it: A weighted combination of look-ahead extension, lane intensity (pixel density), and model detection confidence.
- Why it matters: Low scores indicate faded, missing, or obstructed markings, helping prioritize maintenance.
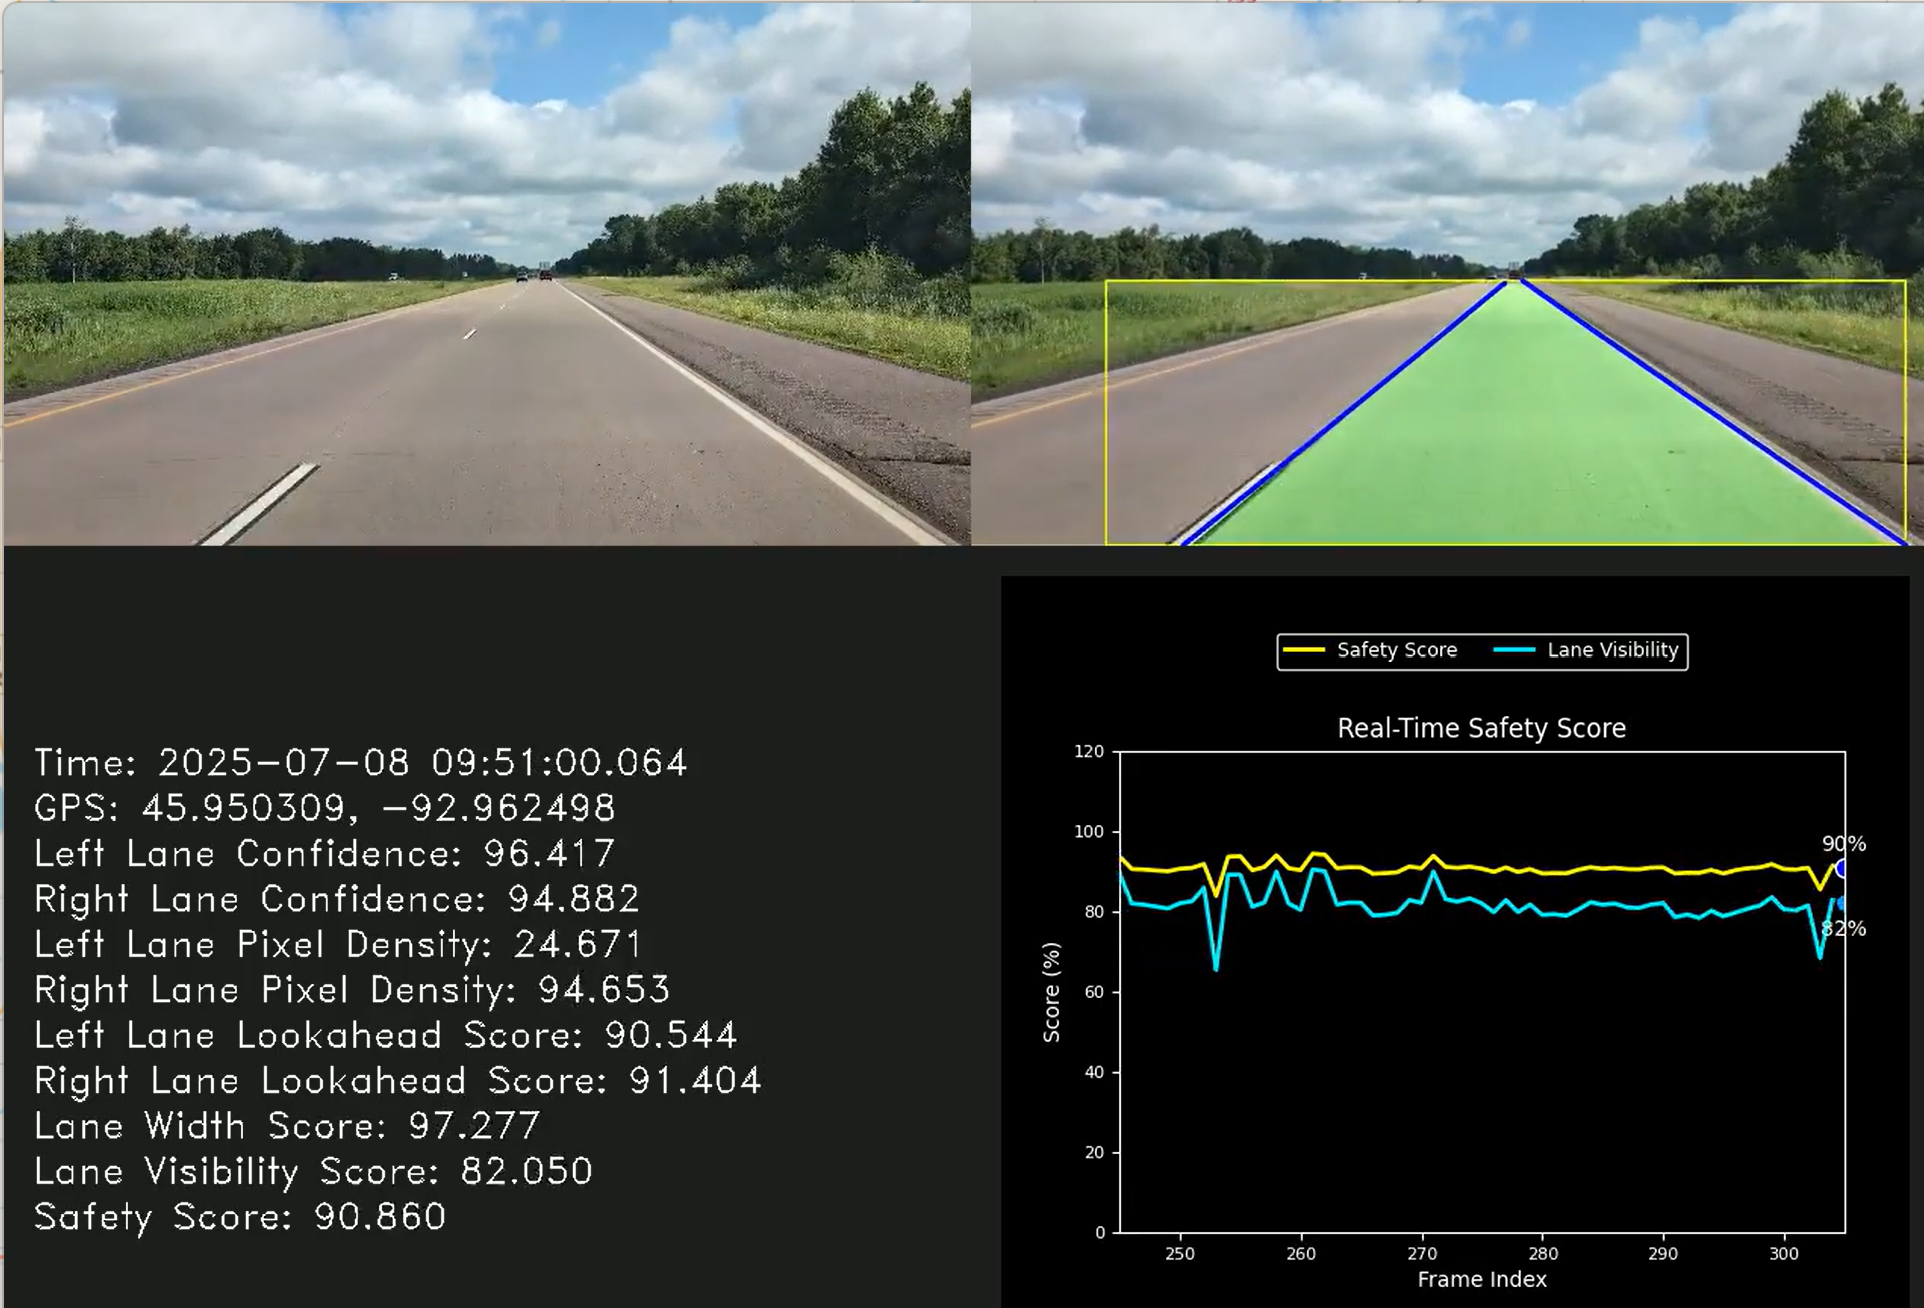
6. Safety Score
The composite KPI that summarizes lane safety in a single number.
- How we measure it: A weighted blend of lane width, visibility, look-ahead, intensity, and confidence.
- Why it matters: This provides a holistic measure of how safe and reliable a roadway segment is, guiding both infrastructure investment and AV readiness.
Why These KPIs Matter
Transportation agencies (DOTs) often rely on manual inspections to track lane quality, a process that is costly and subjective. By automating KPI collection, we can:
- Pinpoint road segments that need maintenance.
- Benchmark lane quality over time.
- Provide AV developers with quantifiable safety scores.
- Help prepare infrastructure for the future of connected and autonomous vehicles.
In short, our KPIs transform raw sensor data into actionable insights for safer roads.